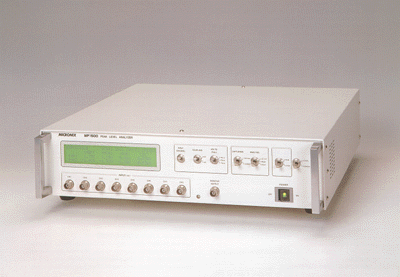
MP1500 Peak Level
Analyzer
New type of measuring instrument that measures and
analyzes only the peak values

Peak Level Analyzer MP1500 is a new type instrument which equips with a high-speed analog peak hold circuit, captures only peak voltages (plus peak and minus peak) of input signal and analyzes the voltages. MP1500 is very useful for development or manufacturing of CD, CD-ROM, MO, HD and LD. A big reduction in working hour and of sight error can be expected in comparison with a conventional measurement, adjustment or inspection by oscilloscope.
APPLICATION
![]() Adjustment, inspection and analysis for an optical
disk [CD, CD-ROM, LD]
Adjustment, inspection and analysis for an optical
disk [CD, CD-ROM, LD]
![]() Inspection and analysis for a magneto-optical disc
[MD, MO]
Inspection and analysis for a magneto-optical disc
[MD, MO]
![]() Amplitude margin check for a hard disk [HD]
Amplitude margin check for a hard disk [HD]
![]() Level fluctuation measurement for an oscillator
Level fluctuation measurement for an oscillator
OPERATION PRINCIPLE
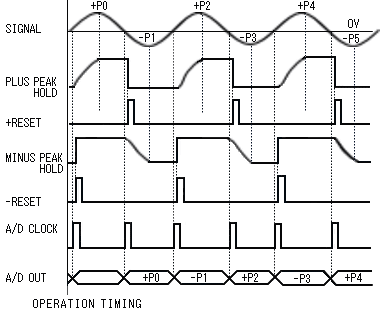
MP1500 equips with two peak hold circuits for plus and minus. At the moment input signal arrives at plus peak point, the peak voltage is stores in a plus peak hold circuit. And at the moment input signal arrives at zero point (0 volt), A / D clock is generated and the peak voltage is converted to digital data by A / D converter. And then +RESET is generated and a plus peak hold circuit becomes a ready state for next cycle as it is reset. A minus peak hold circuit operates as same. So that plus and minus peak data are stored in the memory by turns.
¡@

¡@
ANALYSIS MODE
(1) 3T / 11T ANALYSIS
Peak to peak voltage and the ratio of 3T signal and 11T signal which are
recording signals of optical disk or
magneto-optical disc are calculated on the basis of measured peak voltages and
display on LCD.
COUPLING is usually set to AC and CAPTURING MODE is set to PERIOD.
[CALCULATION and DEFINITION]
Zero address data, the biggest 4 and the smallest 4 data of 4096 data are thrown
away and the remaining 4087
data are made the targets of average value calculation of plus and minus peak ;
+3T = { (+P1) + (+P2) + ••• + (+P256)
} / 256
[Average of the smallest 256 data of plus peaks]
+11T = { (+P1)+(+P2) + ••• + (+P256)
} / 256
[Average of the biggest 256 data of plus peaks]
-3T = { (-P1) + (-P2) + ••• + (-P256)
} / 256
[Average of the biggest 256 data of minus peaks]
-11T = { (-P1) + (-P2) + ••• +
(-P256) } / 256
[Average of the smallest 256 data of minus peaks]
The following calculation is done to be based on above
;
3T = (+3T) - (-3T)
11T = (+11T) - (-11T)
3T / 11T = 3T / 11T ¡Ñ 100(%)

¡@
¡@
¡@
At this analysis mode, the total number of plus and
minus peaks must be more than 4069 during 100ms if CAPTURING MODE is set to
PERIOD.
[LCD DISPLAY]
Setting information and analysis results are displayed on LCD as follows ;
| 3T / 11T ANAL | [CH1] | [DC] | [4V / F] | [NUM] | |
| <3T> | 1.78Vp-p | ¡@ | ¡@ | ¡@ | ¡@ |
| <11T> | 3.51Vp-p | ¡@ | ¡@ | ¡@ | ¡@ |
| <3T / 11T> | 50.7% | ¡@ | ¡@ | ¡@ | ¡@ |
(2) PEAK ANALYSIS
Plus peak voltage, minus peal voltage, peak to peak
voltage and offset voltage are calculated on the basis of measured
peak voltages and displayed on LCD.
COUPLING is usually set to DC and CATURING MODE is set to PERIOD.
[CALCULATION and DEFINITION]
Zero and 21 to 4095 address data of 4096 data are thrown away and 1 to 20
address data are made the targets. Moreover
minimum and maximum data of 10 plus peak data are thrown away and the remaining
8 data are made the targets. Minus
peak data are also same.
+P = { (+P1) + (+P2) + ••• + (P8) } / 8-P = { (-P1) + (-P2) + ••• + (-P8) } / 8
The following calculation is done to be based on above
;
P-P = (+P) - (-P)
OFFSET= { (+P) + (-P) } / 2
 |
At this analysis mode, the total number of plus and
minus peaks must be more than 21 during 100ms if CAPTURING MODE is set to
PERIOD.
[LCD DISPLAY]
Setting information and analysis results are displayed on LCD as follows ;
| PEAKANAL | [CH1] | [DC] | [4V / F] | [NUM] | |
| <+P> | 0.894V | <P-P> | 1.44V | ¡@ | |
| <-P> | -0.546V | <OFFSET> | 0.174V | ¡@ | |
¡@
(3) STATISTICS ANALYSIS
Maximum value (MAX), minimum value (MIN), average value (AVE) and 3S are calculated on the basis of each 2048 data of plus and minus peaks.
At
thisanalysis mode, the total number of plus and minus peaks must be more than
4096 during 100ms if CAPTURING MODE is set to PERIOD.
[LCD DISPLAY]
Setting information and analysis results are displayed on LCD as follows ;
| STATISTICS | [CH1] | [DC] | [4V / F] | [NUM] | |
| ¡@ | <MAX> | <MIN> | <AVE> | <3£U> | |
| <+P> | 1.73V | 1.13V | 1.41V | 0.602V | |
| <-P> | -1.41V | -1.98V | -1.70V | 0.570V | |
MEASURING SEQUENCE
There are two measuring sequence due to CAPTURING MODE.
(1) PERIOD (TIME CONSTANT MODE)
The capturing period of data is 100ms constant. The peak values are measured
during 100ms, converted by A / D converter and then stored in a capturing
memory. And after then the data are transferred to a working RAM.
The
next measuring cycle starts at the moment of completion of the above operation.
On the other hand, the calculation starts.
At the moment of completion of the calculation, the results of the calculation
are output to LCD port and I / F port.
At this mode, 3T / 11T and STATISTICS analysis need more than 4096 data and PEAK
analysis needs more than 21 data.

¡@
¡@
(2) NUMBER
(DATA NUMBER CONSTANT MODE)
The capturing period is till capturing 4096 data. Therefore the period is due to
input frequency. If the calculation and port output of a last cycle have been
already finished at the moment of being stored in a capturing memory, the data
are transferred to a working RAM. If not yet, the data are transferred after
finished. Soon after transferring data, the next cycle starts.
¡@

¡@
RUN / STOP
At the moment RUN / STOP is switched to RUN, the capture starts. The capture
stops at the moment of completion of the current cycle when RUN / STOP is
switched to STOP. Reading original data (raw data) is available only at the stop
state.
INTERFACE
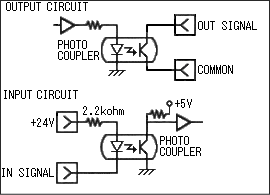
Interface circuit is isolated by photo couplers. In case of control by a personal computer, PIO (parallel in / out) interface board at PC side is convenient. The measured data DATA 0 to 7 is negative logic at the interface connector.

One
analysis item selected is output to DATA 0 to 7 at connector. Analysis mode is
due to from panel control or external control, but analysis item is decided only
by ANALYSIS 2 to 4 of connector on the rear panel no related to LOCAL / REMOTE
switch. As ANAL OUT 0 and 1 output a current analysis item, monitoring these two
bits is useful at LOCAL.
READING ORIGINAL DATA
Original (raw) plus and minus peak values can be read. RESET or CLOCK signal are input by supplying "0" ¡÷ "1" to
ANALYSIS 2 or 3. It is available only at the stop state to read original data.

| Specifications | |||||||||||||||||||||||||||||||||||||||||||||||||||||||||||||||||||||||||||||||||||||||||||||||||||||||||||||||||||||||||
| Input section | |||||||||||||||||||||||||||||||||||||||||||||||||||||||||||||||||||||||||||||||||||||||||||||||||||||||||||||||||||||||||
| Bandwidth | 50Hz to 3MHz | ||||||||||||||||||||||||||||||||||||||||||||||||||||||||||||||||||||||||||||||||||||||||||||||||||||||||||||||||||||||||
| Input resistance | 1Mohm ¡Ó 1% | ||||||||||||||||||||||||||||||||||||||||||||||||||||||||||||||||||||||||||||||||||||||||||||||||||||||||||||||||||||||||
| Input coupling | DC and AC | ||||||||||||||||||||||||||||||||||||||||||||||||||||||||||||||||||||||||||||||||||||||||||||||||||||||||||||||||||||||||
| Input sensitivity | 1, 2, 4V / FULL | ||||||||||||||||||||||||||||||||||||||||||||||||||||||||||||||||||||||||||||||||||||||||||||||||||||||||||||||||||||||||
| Accuracy | ¡Ó 5% of Full scale ¡Ó 1LSB | ||||||||||||||||||||||||||||||||||||||||||||||||||||||||||||||||||||||||||||||||||||||||||||||||||||||||||||||||||||||||
| Input channels | 8channels | ||||||||||||||||||||||||||||||||||||||||||||||||||||||||||||||||||||||||||||||||||||||||||||||||||||||||||||||||||||||||
|
Input damage level |
¡Ó 50V (DC + AC peak) max |
||||||||||||||||||||||||||||||||||||||||||||||||||||||||||||||||||||||||||||||||||||||||||||||||||||||||||||||||||||||||
| Peak detect section | |||||||||||||||||||||||||||||||||||||||||||||||||||||||||||||||||||||||||||||||||||||||||||||||||||||||||||||||||||||||||
| Resolution | 8bits | ||||||||||||||||||||||||||||||||||||||||||||||||||||||||||||||||||||||||||||||||||||||||||||||||||||||||||||||||||||||||
| Voltage conversion range |
Ex. In case of 4V / FULL +Full = +2V, -Full = -2V |
||||||||||||||||||||||||||||||||||||||||||||||||||||||||||||||||||||||||||||||||||||||||||||||||||||||||||||||||||||||||
|
Min. peak to peak time
|
more than 167ns *Time from plus peak to minus peak or from minus peak to plus peak. |
||||||||||||||||||||||||||||||||||||||||||||||||||||||||||||||||||||||||||||||||||||||||||||||||||||||||||||||||||||||||
| Memory section | |||||||||||||||||||||||||||||||||||||||||||||||||||||||||||||||||||||||||||||||||||||||||||||||||||||||||||||||||||||||||
| Memory size |
4096 ¡Ñ 8bits |
||||||||||||||||||||||||||||||||||||||||||||||||||||||||||||||||||||||||||||||||||||||||||||||||||||||||||||||||||||||||
|
Data format |
+Full: 255 (FFH) 0V: 128 (80H) -Full: 0 (00H) *Negative logic at an interface connector. |
||||||||||||||||||||||||||||||||||||||||||||||||||||||||||||||||||||||||||||||||||||||||||||||||||||||||||||||||||||||||
| Capture data | |||||||||||||||||||||||||||||||||||||||||||||||||||||||||||||||||||||||||||||||||||||||||||||||||||||||||||||||||||||||||
| Capture mode | PERIOD and NUMBER | ||||||||||||||||||||||||||||||||||||||||||||||||||||||||||||||||||||||||||||||||||||||||||||||||||||||||||||||||||||||||
| Period | Data are captured during about 100ms | ||||||||||||||||||||||||||||||||||||||||||||||||||||||||||||||||||||||||||||||||||||||||||||||||||||||||||||||||||||||||
| Number | 4096 data are captured | ||||||||||||||||||||||||||||||||||||||||||||||||||||||||||||||||||||||||||||||||||||||||||||||||||||||||||||||||||||||||
| Control | RUN and STOP | ||||||||||||||||||||||||||||||||||||||||||||||||||||||||||||||||||||||||||||||||||||||||||||||||||||||||||||||||||||||||
| Analysis mode | |||||||||||||||||||||||||||||||||||||||||||||||||||||||||||||||||||||||||||||||||||||||||||||||||||||||||||||||||||||||||
| 3T / 11T analysis |
3T (peak to peak voltage of 3T recording signal), 11T (peak to peak voltage of 11T recording signal) and 3T / 11T (ratio of 3T and 11T) |
||||||||||||||||||||||||||||||||||||||||||||||||||||||||||||||||||||||||||||||||||||||||||||||||||||||||||||||||||||||||
| Peak analysis | +P (plus peak value), -P (minus peak value) and OFFSET (offset voltage) | ||||||||||||||||||||||||||||||||||||||||||||||||||||||||||||||||||||||||||||||||||||||||||||||||||||||||||||||||||||||||
| Statistics analysis |
MAX (maximum value), MIN (minimum value), AVE (average value) and 3£U |
||||||||||||||||||||||||||||||||||||||||||||||||||||||||||||||||||||||||||||||||||||||||||||||||||||||||||||||||||||||||
| Output section | |||||||||||||||||||||||||||||||||||||||||||||||||||||||||||||||||||||||||||||||||||||||||||||||||||||||||||||||||||||||||
| Display | 4lines ¡Ñ 40characters LCD with backlight | ||||||||||||||||||||||||||||||||||||||||||||||||||||||||||||||||||||||||||||||||||||||||||||||||||||||||||||||||||||||||
|
Monitor output ¡@ |
A signal of selected channel of
CH1 to CH8 is output. |
||||||||||||||||||||||||||||||||||||||||||||||||||||||||||||||||||||||||||||||||||||||||||||||||||||||||||||||||||||||||
| Interface | |||||||||||||||||||||||||||||||||||||||||||||||||||||||||||||||||||||||||||||||||||||||||||||||||||||||||||||||||||||||||
| In / output circuit | Due to photo couplers | ||||||||||||||||||||||||||||||||||||||||||||||||||||||||||||||||||||||||||||||||||||||||||||||||||||||||||||||||||||||||
| Interface condition | Direct connection to PIO module, IRT-32 (98) E / PO-32 (98) E (CONTEC) is available. | ||||||||||||||||||||||||||||||||||||||||||||||||||||||||||||||||||||||||||||||||||||||||||||||||||||||||||||||||||||||||
|
Connector pin assignment |
|||||||||||||||||||||||||||||||||||||||||||||||||||||||||||||||||||||||||||||||||||||||||||||||||||||||||||||||||||||||||
|
|||||||||||||||||||||||||||||||||||||||||||||||||||||||||||||||||||||||||||||||||||||||||||||||||||||||||||||||||||||||||
|
|||||||||||||||||||||||||||||||||||||||||||||||||||||||||||||||||||||||||||||||||||||||||||||||||||||||||||||||||||||||||
| General | |||||||||||||||||||||||||||||||||||||||||||||||||||||||||||||||||||||||||||||||||||||||||||||||||||||||||||||||||||||||||
| Operating temperature | 0 to 40ºC (Guaranteed at 23 ¡Ó 10ºC) | ||||||||||||||||||||||||||||||||||||||||||||||||||||||||||||||||||||||||||||||||||||||||||||||||||||||||||||||||||||||||
| Operating humidity | less than 40ºC / 90%RH (Guaranteed at less than 33ºC / 80%RH) | ||||||||||||||||||||||||||||||||||||||||||||||||||||||||||||||||||||||||||||||||||||||||||||||||||||||||||||||||||||||||
| Storage temperature | -10 to 60ºC, less than 60ºC / 80%RH | ||||||||||||||||||||||||||||||||||||||||||||||||||||||||||||||||||||||||||||||||||||||||||||||||||||||||||||||||||||||||
| Power supply | 90 to 127V AC | ||||||||||||||||||||||||||||||||||||||||||||||||||||||||||||||||||||||||||||||||||||||||||||||||||||||||||||||||||||||||
| Power consumption | approx. 31VA | ||||||||||||||||||||||||||||||||||||||||||||||||||||||||||||||||||||||||||||||||||||||||||||||||||||||||||||||||||||||||
| Dimensions | 430 (W) ¡Ñ 99 (H) ¡Ñ 440 (D) mm | ||||||||||||||||||||||||||||||||||||||||||||||||||||||||||||||||||||||||||||||||||||||||||||||||||||||||||||||||||||||||
| Weight | approx. 16.5kg | ||||||||||||||||||||||||||||||||||||||||||||||||||||||||||||||||||||||||||||||||||||||||||||||||||||||||||||||||||||||||
| Accessories: | Power cable (1pc) | ||||||||||||||||||||||||||||||||||||||||||||||||||||||||||||||||||||||||||||||||||||||||||||||||||||||||||||||||||||||||
| Fuse (1pc) | |||||||||||||||||||||||||||||||||||||||||||||||||||||||||||||||||||||||||||||||||||||||||||||||||||||||||||||||||||||||||
| Instruction manual (1pc) | |||||||||||||||||||||||||||||||||||||||||||||||||||||||||||||||||||||||||||||||||||||||||||||||||||||||||||||||||||||||||
| Options : | Memory addition | ||||||||||||||||||||||||||||||||||||||||||||||||||||||||||||||||||||||||||||||||||||||||||||||||||||||||||||||||||||||||
| Rack mount kit | |||||||||||||||||||||||||||||||||||||||||||||||||||||||||||||||||||||||||||||||||||||||||||||||||||||||||||||||||||||||||
| BNC coaxial cable | |||||||||||||||||||||||||||||||||||||||||||||||||||||||||||||||||||||||||||||||||||||||||||||||||||||||||||||||||||||||||
|
|
|||||||||||||||||||||||||||||||||||||||||||||||||||||||||||||||||||||||||||||||||||||||||||||||||||||||||||||||||||||||||
Products list | brand | Model No. | Home