| |
|
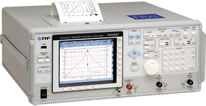
FRA5087 Frequency Response Analyzer - Frequency range 0.1mHz to 10MHz / 15MHz , From ultra low frequency to high frequency.
High density measurements of up to 20,000 points at one sweep are possible.Logarithmic equal interval setting and auto-magnification in sections where values greatly change are possible. Resolution is 0.1mHz.
| |
| |
 |
 |
 |
|
| Frequency Response Analyzer |
FRA5087/FRA5097 |
|
 |
 |
| |
| |
Frequency range 0.1mHz to 10MHz / 15MHz
|
|
|
|
| |
 From ultra low frequency to high frequency. From ultra low frequency to high frequency.
High density measurements of up to 20,000 points at one sweep are possible.
Logarithmic equal interval setting and auto-magnification in sections where values greatly change are possible. Resolution is 0.1mHz.
| FRA5087 : |
0.1mH to 10MHz |
Higher than the conventional 2.2MHz model! |
| FRA5097 : |
0.1mH to 15MHz |
|
|
| |
Gain accuracy : ±0.05 dB , Phase accuracy : ±0.3° |
|
|
|
| |
| Digital Fourier transforms and a self calibration function assure that measurements will always be highly accurate. |
| |
| Auto ranging which optimizes the measurement range at every measurement point and a high resolution A/D converter secure a wider dynamic range. Measurement is secured if a great change occurs during measurement. |
| |
| Oscillator output 2-channel and analysis inputs are isolated from the cabinet by 250Vrms. In this way, the instrument can be protected from damage by an erroneous signal connection. |
| |
| Input range is switched automatically according to the input signal level, so setup of voltage sensitivity is not necessary for the frequency response analyzer. |
| |
| Bode, Nyquist, Nicols, and Cole-Cole plots can be displayed. Following measurement, interconversion is also available. |
| |
Impedance display function(optional for FRA5087) |
|
|
|
| |
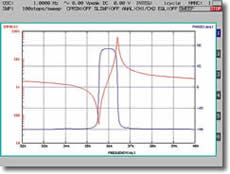 Impedance can be accurately measured and displayed. Moreover, open-short correction, maximum and minimum value displays, and screen image storage can be done. Impedance can be accurately measured and displayed. Moreover, open-short correction, maximum and minimum value displays, and screen image storage can be done.
| FRA5087 : |
Optional (PA-001-1231) |
| FRA5097 : |
Standard |
|
| |
Excellent functions are built-in
|
|
|
|
| |
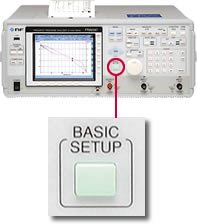
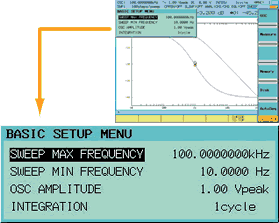
A basic setup screen is displayed simply by pressing the basic setup key. The upper lower limits, amplitude, and number of integrations for measuring frequency (sweep) can be set on one screen. The conventional model's nuisance of setting each item by switching the screen can thus be avoided.
|
| |
| The contents of the setup and measured data stored in the memory before turning off power are held if power is turned off. |
| |
| Measuring conditions can be set via an external personal computer and measured data can be read out to it via GPIB and USB. |
| |
Easy saving and reading by USB memory |
|
|
|
| |
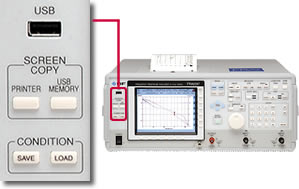 Measured data can be stored and loaded into a USB memory device. Furthermore, the following functions are available.
A screen can be output to the USB memory and printer by the press of a key.
Setup conditions can be saved into and loaded from the USB memory by the press of a key. |
| |
Data stored in the USB memory can be read out to a personal computer for graphic display and saving in a CSV format.
|
| |
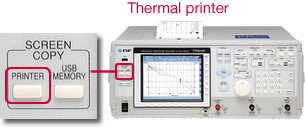 A printer for outputting hard copies of on-screen images onto thermosensitive paper is built-in, which makes saving measurements and creating reports convenient. A printer for outputting hard copies of on-screen images onto thermosensitive paper is built-in, which makes saving measurements and creating reports convenient. |
| |
| A frequency response graph and setup menu for measuring conditions can be displayed on a crisp color LCD. |
|
|
|

 Impedance can be accurately measured and displayed. Moreover, open-short correction, maximum and minimum value displays, and screen image storage can be done.

 A printer for outputting hard copies of on-screen images onto thermosensitive paper is built-in, which makes saving measurements and creating reports convenient.