| |
| |
The widest 30MHz bandwidth digitizer in its product ranges as well as the basic digital modulation analysis S/W. Its 30 MHz standard digitizer provides the optimized H/W conditions for various mobile and wireless communication measurements such as WiMAX/WiBRO etc.
|
|
 14bit ADC with 85.6MHz Sampling Frequency 14bit ADC with 85.6MHz Sampling Frequency
 Dynamic Range over 80dB Dynamic Range over 80dB
 32M samples Data with 128MBytes memory 32M samples Data with 128MBytes memory
 Standard FFT, Spectrogram, Digital Modulation Analysis Standard FFT, Spectrogram, Digital Modulation Analysis
 Save I/Q data file Save I/Q data file
 Digital Modulation Analysis like PSK(8,16,64), QAM(4,8,16,32,64,128,256), BPSK,QPSK Digital Modulation Analysis like PSK(8,16,64), QAM(4,8,16,32,64,128,256), BPSK,QPSK
|
| |
 |
|
|
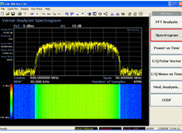
 Spectrogram Measurement Spectrogram Measurement |
Display the change of the frequency in time domain, and analysis the wide bandwidth digital modulation signal in 30MHz bandwidth.
- FFT
- Spectrogram
- Power vs Time
- I/Q Wave vs Time
- Digital Modulation Analysis
- CCDF |
|
| |
 |
|
|
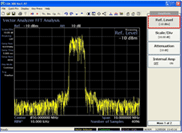
 FFT measurement FFT measurement |
| Measure and display the FFT signal Analysis and the dynamic range when the digital Modulation signal input. |
|
| |
 |
|
|
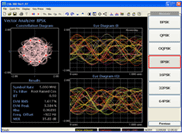
 Modulation analysis Modulation analysis |
Measure and display the value of I/Q Polar vector, I/Q Eye diagram graph & EVM, Rho, MER, Frequency offset.
- PSK (8, 16, 64)
- QAM (4, 8, 16, 32, 64, 128, 256)
- BPSK, QPSK
|
|
|
| |
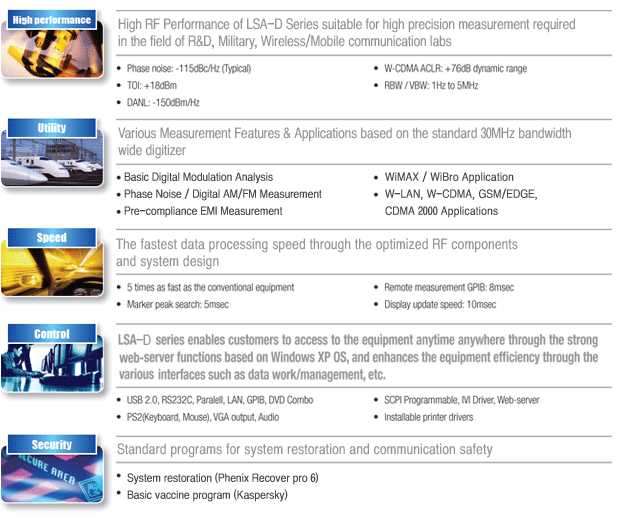
Various customized measurement functions for analysis of the characters of RF & Wireless communications in the field of Education, R&D, Military, and Industry. Its powerful measurement functions help the users analyze the measured data by required test categories , and find the optimized solutions for the detected problems.
|
|
|
 |
|
|
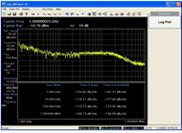
 Phase Noise Measurement Phase Noise Measurement |
The phase noise is one of the important factors to evaluate short-term stability of signals. The Frequency offset values are automatically set by the start frequency, and an accurate phase noise value can be obtained through the smoothed value. This function can be used as a basic tool to enable the development and optimum production environment (in-line testing) that requires a design verification and trouble shooting.
- One-Button measurement
- Continuous phase noise plot
offset range : 10Hz ~ 1GHz
- Display method : Log plot / Numerical results table
- Narrow / Wide sweep mode
- Average and smoothing curve
- Automatic carrier search |
|
| |
 |
|
|
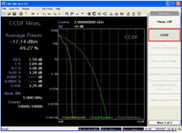
 CCDF CCDF |
Power CCDF (Complementary Cumulative Distribution Function) is a function to remove unclear power characteristics of constructively amplified and decoded signals and to gain clear signal status in the communication system, especially in the digital communication. |
|
| |
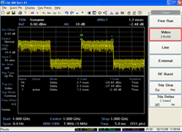
SG : CF=1GHz, Level=-20dBm
PG : PW=1us, PRF=1kHz |
|
|
 Pulse Measurement Pulse Measurement |
Pulse Measurement is used for the measurements precisely of the Pulse signals like PRF of Radar with the functions of the Video Trigger or RF Burst Trigger based on High performance Digital IF signal processing |
|
| |
 |
|
|
 Multi Channel Power Multi Channel Power |
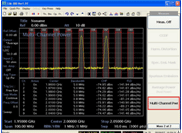
This function enables the users to measure the channel powers in various signals at one time, and display on the screen. The users can select the several different frequency ranges for their uses. |
|
| |
 |
|
|
 TOI (Third Order Intercept) TOI (Third Order Intercept) |
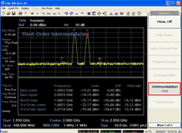
TOI (Third order interception) is one of the important measurement elements to evaluate the short term stability of signals as an item to measure the phase noises of devices to be measured. It would be used as the basic tool to develop design verification and trouble shooting and to build up the optimum production environment (in-line testing). |
|
| |
 |
|
|
 Spurious Emissions Spurious Emissions |
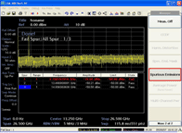
As a function to identify unnecessary wave components of devices to be measured, this enables users to set frequency bands using range tables, set a maximum of 200 different range values by adjusting RBW/VBW/sweep time and limit corresponding to each frequency, and automatically display unnecessary wave components for each range by 10 peak values. |
|
| |
 |
|
|
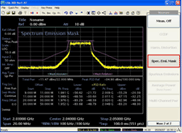
 Spectrum Emission Mask Spectrum Emission Mask |
This is a function to automatically analyze pass/fail by indicating the limit line set in advance compatible to the communication standards of frequency bands and level values. ISA provides mask functions such as WLAN (802.11a/b/g), W-CDMA (3GPP, Base), and W-CDMA(3GPP, Mobile) and enables users to set the limit line required by the communication standards at their own discretion or to modify it for use easily. |
|
| |
 |
|
|
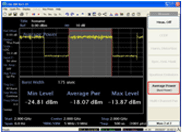
 Average Power (Burst Power) Average Power (Burst Power) |
As a measurement function to analyze the burst signals that occur spontaneously, this is used to analyze the power characteristics of signals on the time axis. This function automatically calculates burst length, average power, and min/max power in a zero span condition and displays them on the screen. |
|
| |
 |
|
|
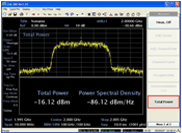
 Total power Total power |
All the power values and power spectral densities within the frequency span selected by users. Total power indicates the channel power in the span region displayed on the screen, and power spectral density is used for the same purposes as the auto spectral density indicating the rate of spectrum changes in relation to the frequency. |
|
| |
 |
|
|
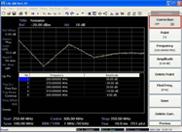
 Amplitude Correction Factors Amplitude Correction Factors |
Using the Amplitude-correction factor, it is possible to set compensation values for levels appropriate to the measurement environment. It is possible to individually set and control antennas, cables, other factors, or the discretionary factors of users, and to load and save using file dialog. |
|
| |
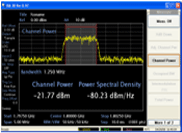
Channel Power |
|
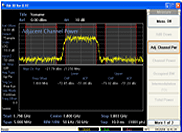
Adjacent Channel Power |
|
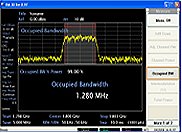
Occupied Bandwidth |
 |
|
 |
|
 |
|
| |
9 Markers/Marker Table |
|
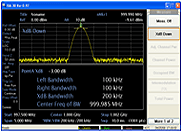
X dB Down |
|
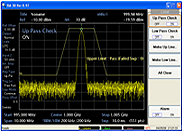
Limit |
 |
|
 |
|
 |
|
| |
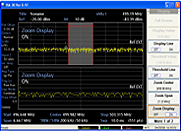
Zoom Display |
|
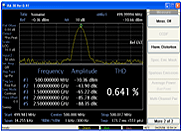
Total Harmonic Distortion |
|
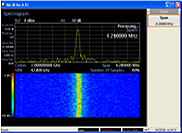
Spectrogram |
 |
|
 |
|
 |
|
| |
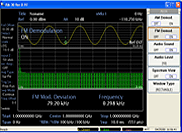
AM/FM Demodulation |
|
|
|
|
 |
|
|
|
|
|
