Graphtec GL900 Series |
 |
||||||||||||||||||||||||||||||||||
| Voltage , Temperature , Humidity , Pulse , Logic | |||||||||||||||||||||||||||||||||||
|
|||||||||||||||||||||||||||||||||||
Specifications , Download brochure GL900-8 , Download brochure GL900-4 , Options and supplies |
|||||||||||||||||||||||||||||||||||
| In compliance with various test requirements, this data logger is capable of performing high-speed simultaneous voltage and temperature measurements | |||||||||||||||||||||||||||||||||||
| Easy-to-use upright high-speed isolated 8-channel multifunction logger | |||||||||||||||||||||||||||||||||||
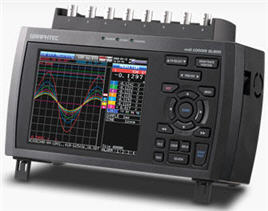
| An easy-to-use upright device enabling isolated 8-channel multifunction input, the GL900 is capable of performing high-speed simultaneous measurements of voltage, temperature, and various other phenomena. | 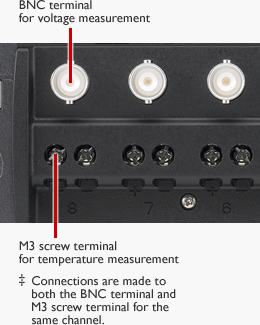 |
||||||||||||||||||||||||||||||||||
| Voltage : +/-20 mV to +/-500 V | |||||||||||||||||||||||||||||||||||
| Temperature : Thermocouples: K, J, E, T, R, S, B, N, W | |||||||||||||||||||||||||||||||||||
| Humidity : 0 to 100% (the B-530 option is required) | |||||||||||||||||||||||||||||||||||
| Pulse : 4 channels Count, Inst., Rpm | |||||||||||||||||||||||||||||||||||
| Logic : 4 channels ‡ Select either Pulse or Logic | |||||||||||||||||||||||||||||||||||
| Data can be captured to PC-friendly USB memory sticks | |||||||||||||||||||||||||||||||||||
| Long-term data can be captured directly to built-in 256-MB flash memory or to an external USB memory stick at sampling intervals of from 1 ms to 1 min. For high-speed sampling at intervals faster than 1 ms, up to one million data points can be captured to internal RAM. |  |
||||||||||||||||||||||||||||||||||
| Example of 8-channel analog measurement | |||||||||||||||||||||||||||||||||||
|
|||||||||||||||||||||||||||||||||||
The USB memory stick must be a standard model (without fingerprint recognition or other proprietary features). |
|||||||||||||||||||||||||||||||||||
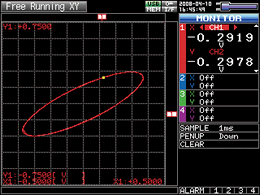
Can be used as an X-Y recorder The GL900 reproduces analog X-Y recorder movements and provides the illusion of pen up/pen down movements. It can be operated like an analog X-Y recorder and can also be used as a 4-pen X-Y recorder. The digital data format facilitates post-measurement confirmation of data values and report creation. |
 |
||||||||||||||||||||||||||||||||||
High-precision temperature measurement even during high-speed sampling Lets users perform high-precision temperature measurements even during high-speed sampling – ideal for performing combined voltage and temperature measurements. |
|||||||||||||||||||||||||||||||||||
Comprehensive built-in trigger and timer functions Using a combination of trigger and timer functions eliminates superfluous data and enables capture of only the required data. |
|||||||||||||||||||||||||||||||||||
Setting example 1 To perform measurement over a four-day period starting January 10
|
|||||||||||||||||||||||||||||||||||
Setting example 2 To perform measurements of abnormal signals during device operations
|
|||||||||||||||||||||||||||||||||||
Setting example 3 To perform measurements every 20 minutes
|
|||||||||||||||||||||||||||||||||||
Setting example 4 To perform measurements for a period of one hour, every four hours, daily With the timer set to daily cycle status, data is captured repeatedly for one hour every four hours.
|
|||||||||||||||||||||||||||||||||||
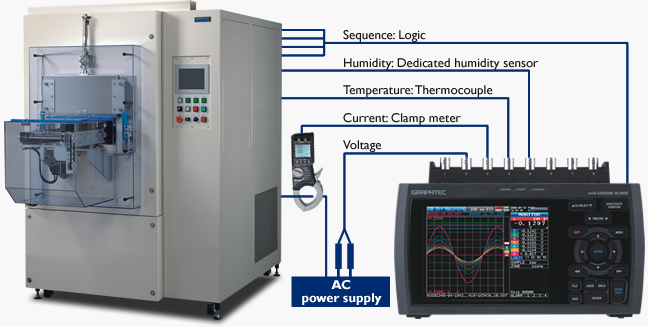
High-voltage measurement capability The wide 500 V range enables 100 to 240 VAC power supply voltage waveform measurements. Using logic input and a clamp meter simultaneously allows measurement of a device’s power supply voltage and current concurrently with sequential control of various points.
|
|||||||||||||||||||||||||||||||||||
Built-in, large-format 5.7-inch color LCD for easy-to-read waveforms The bright, easy-to-read large-format 5.7-inch color TFT LCD provides vivid, easy-to-read waveform displays. Cursor keys enable fast, easy control and setup. The waveform display can be scrolled at high-speed – 10 ms/DIV.
|
|||||||||||||||||||||||||||||||||||
| Free Running display for waveform-checking without the need for data capture | |||||||||||||||||||||||||||||||||||
| The Free Running display lets users check input signal waveforms even before measurements begin. Since waveforms are displayed on each setup screen, users can make settings while viewing the waveforms. | 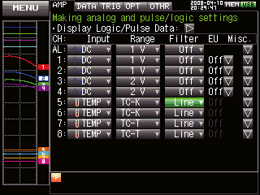 |
||||||||||||||||||||||||||||||||||
Easy PC measurement via USB; remote monitoring via Ethernet web server and FTP functions The USB and Ethernet connections enable transfer of captured data to your PC and setup and control of the GL900 from a PC, even without the PC software provided standard with the GL900.
Web server/FTP server functions Waveform display and GL900 setup operations can be performed via a web browser (e.g., Internet Explorer). In addition, data files captured to the GL900’s internal memory or to a USB memory stick can be transferred or deleted from the PC. USB drive mode When your GL900 is connected to your PC via the USB interface, the GL900 can be operated in USB mode to enable fast, easy data transfers from internal memory to the PC. NTP client function Simply connect the GL900 to an NTP server via an Ethernet connection to synchronize GL900 time with NTP server time at periodic intervals |
|||||||||||||||||||||||||||||||||||
Dedicated software for real-time data capture Three measurement screens are provided to allow selection of the screen that best suits measurement needs.
|
|||||||||||||||||||||||||||||||||||
Simple operations for anyone Easy-to-use software using icon keys for intuitive operations
|
|||||||||||||||||||||||||||||||||||
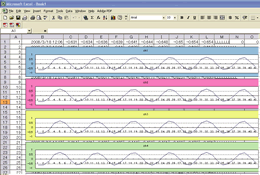
Convenient functions Various convenient data-processing functions are built in. |
|||||||||||||||||||||||||||||||||||
|
 |
||||||||||||||||||||||||||||||||||


